In step 3 we created two candidate final methods for the 60 and 100 SPD assays. Take the file pq500_60spd_plasma_multireplicate_results_refined.sky and pq500_1000spd_plasma_multireplicate_results_refined.sky, and resave them in the folder Step 4. Plasma Light-Heavy Narrow Window, with names like pq500_60spd_plasma_final_replicates.sky and _pq500_100spd_plasma_final_replicates.sky. In this step we’ll analyze the results of the light/heavy methods created in Step 3. Of particular interest will be the histogram of coefficient of variance values for the peak areas.
Use File / Import Results / Add single-injection replicates in files and press Okay. Select the 10 files in Step 4. Plasma Light-Heavy Narrow Window\Raw\60SPDReplicates and press Open. Remove the common prefix and press Okay to load the results. Remove the PlasmaMultiReplicate with Edit / Manage Results and Save the document.
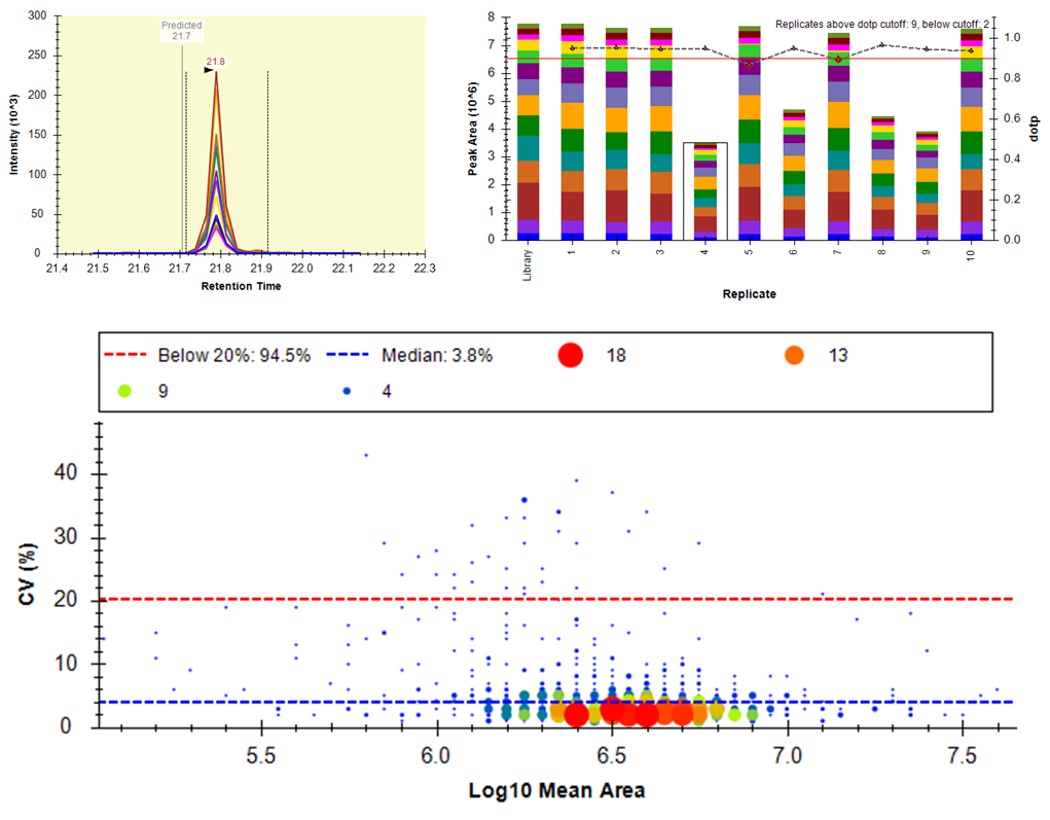
Select View / Peak Areas / CV Histogram. The CV histograms have ~94% of the targets with CV < 20%, with medians of 3.8 and 4.9%, which are excellent.

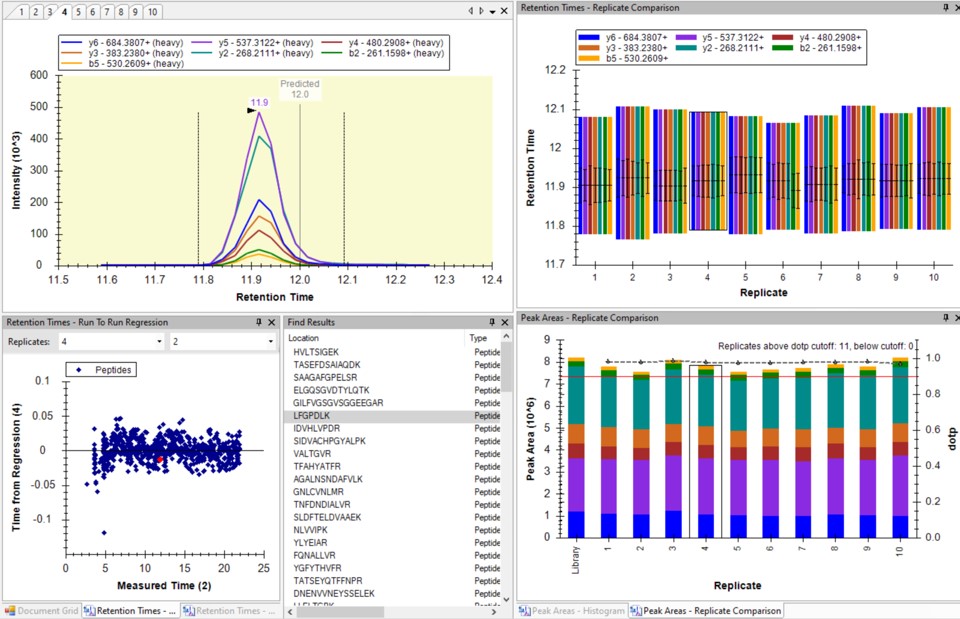
You can click on the histogram, which will open a Find Results window with some of the peptides that are close in CV to the value that was pressed. Double clicking any peptide sequence in the Find Results table will make that peptide active, whereupon one can check the peak shape, peak area, and retention time variations for the 8 replicates. Many/most peptides have results like LFGPDLK below.
Now we will add in the light precursors, that were measured but currently are not in the Skyline document. Save the document and then Save again with the names pq500_60spd_plasma_final_lightheavy_replicates.sky and pq500_100spd_plasma_final_lightheavy_replicates.sky.
Use Refine / Advanced, and select the Add box. The Remove label type combo box title changes to Add label type. Select light and press Okay to close the Refine dialog. Each peptide will now have its light precursor added. Use Edit / Manage Results, select all the replicates and press the Reimport button.


This is the end of Step 4. We've demonstrated how to analyze replicate data for absolute quantitation with light and heavy peptides. A next step that some users will want to perform is a dilution curve. For absolute quantitation this takes two forms.
The Light Dilution is a little easier to perform, because with the Settings / Peptide Settings / Modifications / Internal standard type is set to heavy, and thus Skyline uses the integration boundaries of the heavy peptides to integrate the light signals and determine whether the light/heavy ratios are sufficient for quantitation.
The Heavy Dilution is difficult, because eventually Skyline can't find the heavy peptide signal, and doesn't keep a constant integration boundary. Sometimes Skyline will jump over to the next biggest LC peak and ruin the dilution curve. We have sometimes used a script to set constant integration boundaries and solve this issue.
Calculating LOQs and LODs for large scale assays is still a little difficult, and we have used python scripts to do this. Skyline is also working on making improvements, and there will be updates in the future. We are submitting a paper soon that will have links to these scripts, for the intrepid that might be interested in exploring them.
| Attached Files | ||
step4_2dcvs.jpg step4_example_bad_cv.jpg step4_good_cv_example.jpg step4_lightheavy_examples.jpg step4_lightheavy_tree.jpg step4_area_cvs.jpg step4_lightheavy_cvs.jpg