Many researchers are not quite done once they have a "final-assay". Typically users want to perform a larger number of replicate injections with this candidate assay. A typical practice for assays that will be used for a large number of samples is to characterize the stability of the peptides and reproducibility of the LC/MS system using a 5x5 experiment. In this experiment, 5 different samples are digested and prepared, and each aliquoted into 5 vials, for 25 total. The vials are stored in the autosampler or a refridgerator at the same temperature, and each day for 5 days in a row, at least 5 replicates are acquired for each of the 5 vials. The inter-day, intra-day, and inter-sample variability can be assessed, and poorly performing peptides can be removed.
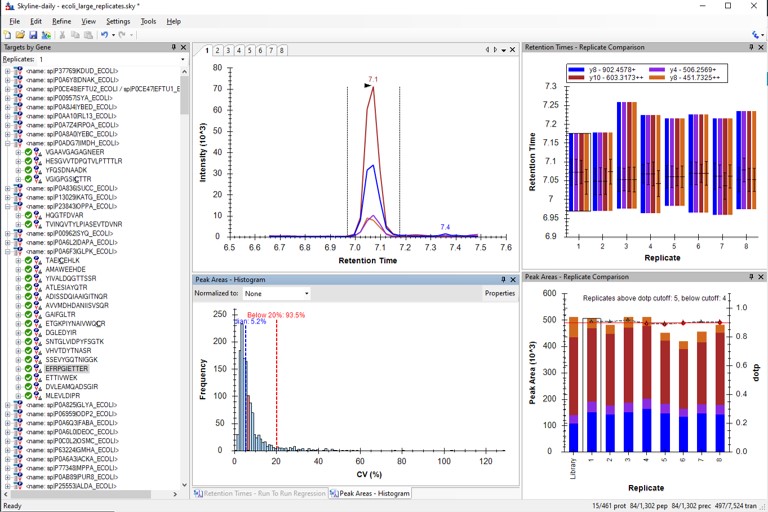
Here we will simply load some replicate data acquired with a final assay very similar to the one that we created in Step 2 of the walkthrough.
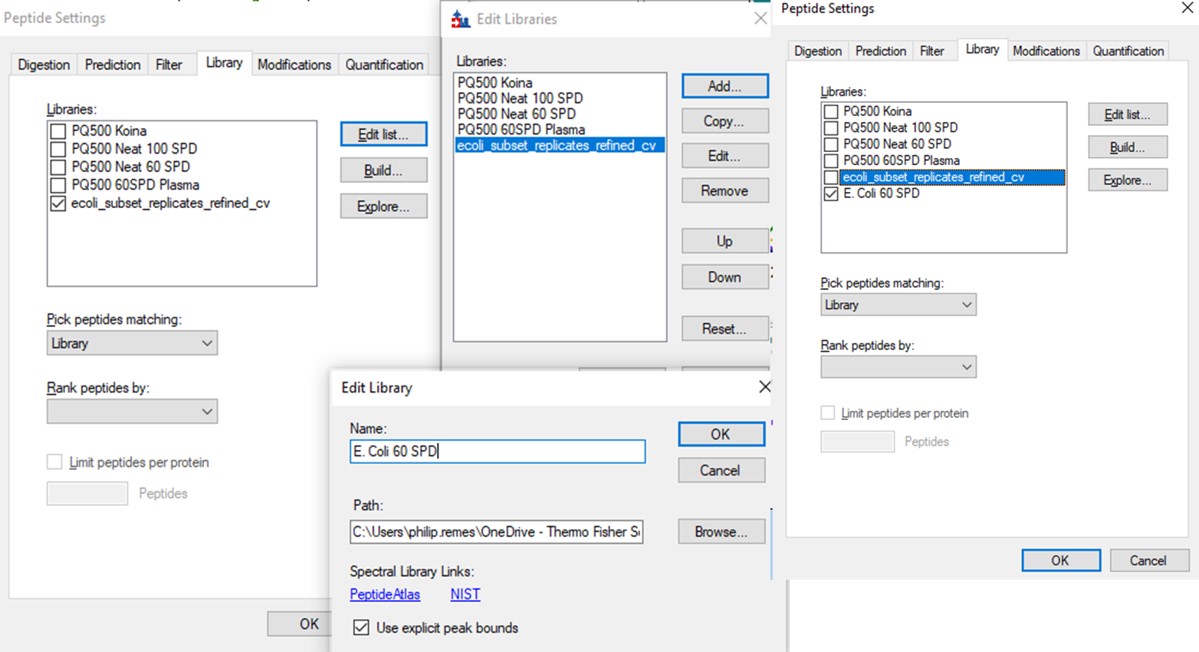
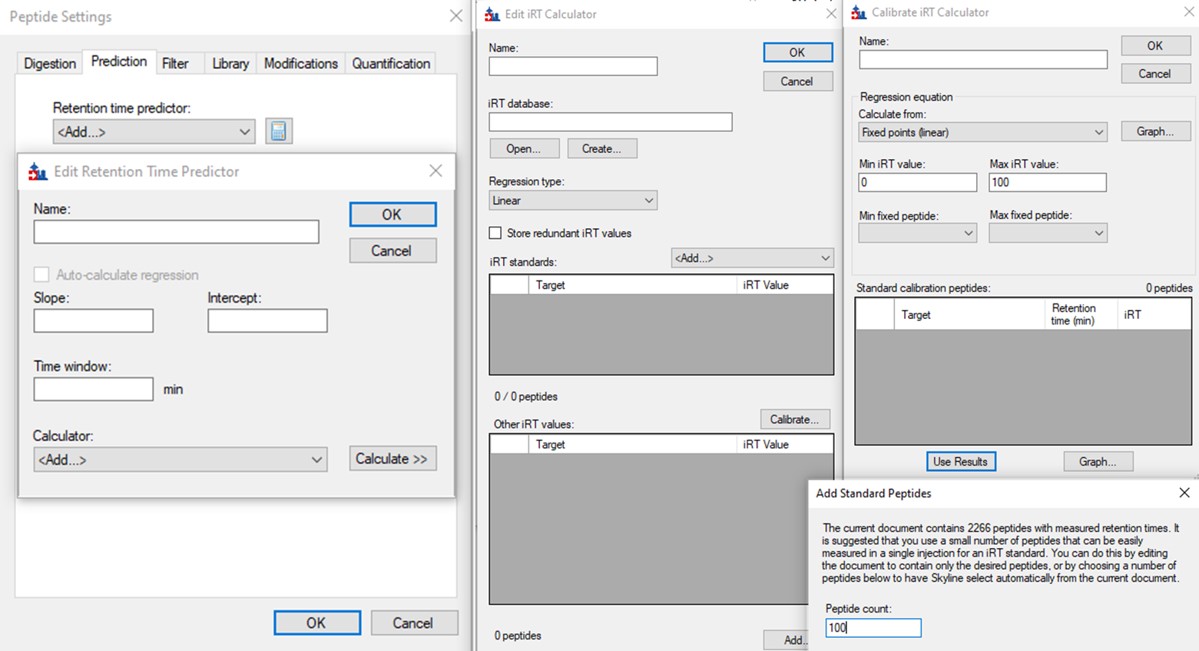
An action that we could have included at the end of Step 2 is to create a final spectral library, once all the final peptides are refined and their retention times are known. In the future when replicates are imported, the retention time filtering for MS/MS IDs will be relative to the spectral library you have created, and not from the discovery runs, which can be useful. We can do this from the Step 2. Validation with Subsets\ecoli_subset_replicates_refined_cv.sky file.
Use View / Retention Times / Regression / Run-to-Run. There are some peaks that are not consistently picked. Click on any of these outliers to see what they look like. Most are some kind of noise. Maybe they were "reproducible noise" in a previous step, or maybe there are interferences that get picked up over time with multiple replicates.
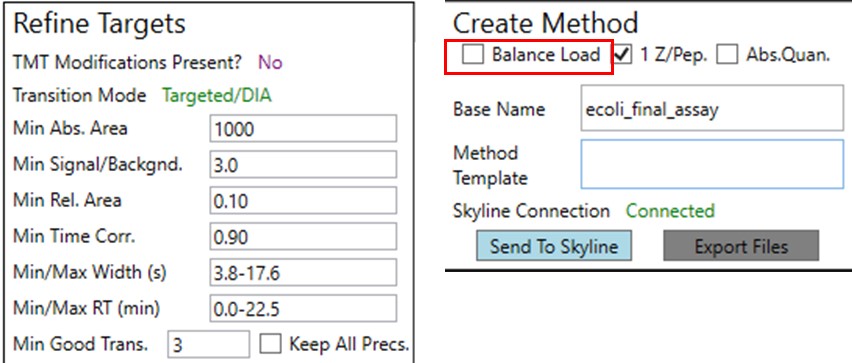
We could filter out the remaining peptides with poor CV's. This actually gets rid of all but a few of the retention time outliers. Additionally we could run PRM Conductor, and set some more stringent filtering settings, like in the figure below. We would unclick the Balance Load box to ensure that no precursors are filtered based on whether they fit in less than the cycle time, and press Send to Skyline.
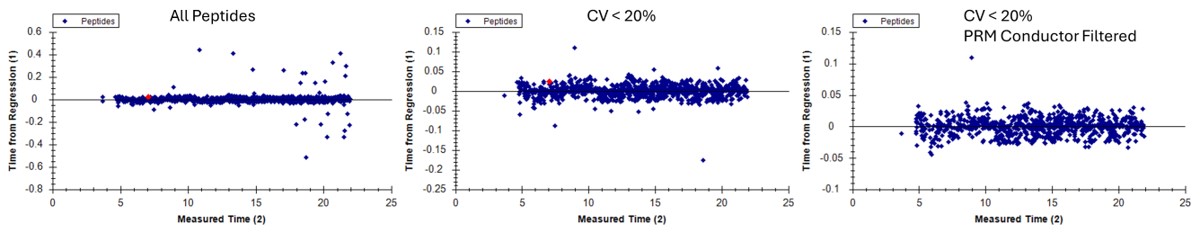
Here we see the effect on the retention time outliers from run to run. Almost all the outliers are gone.
Let's try another way of filtering the retention time outliers. Go back and open the file Step 2. Validation with Subsets\ecoli_subset_replicates_refined_cv.sky.
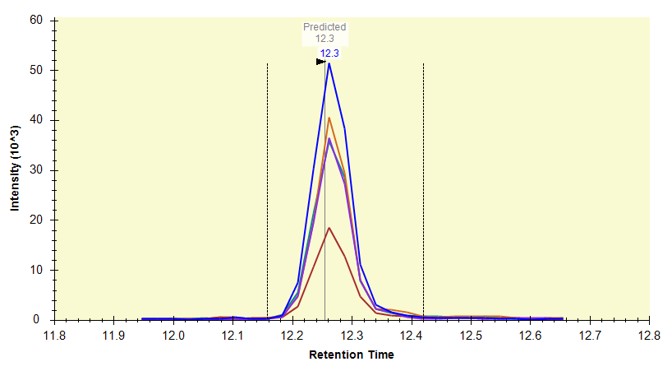
The background of the chromatogram plots is now beige, and there is a faint vertical line that says "Predicted" on the plots, like below.
Use View / Retention Times / Regression / Score-to-Run, and on the plot that comes up, right click and in the Calculator menu, select the E. Coli PRM. Make sure that you are in the right-click, Plot / Residuals mode. Some of the dots in the plot are pink just because our document here has some peptides that weren't in the calculator. That's fine for this walkthrough.
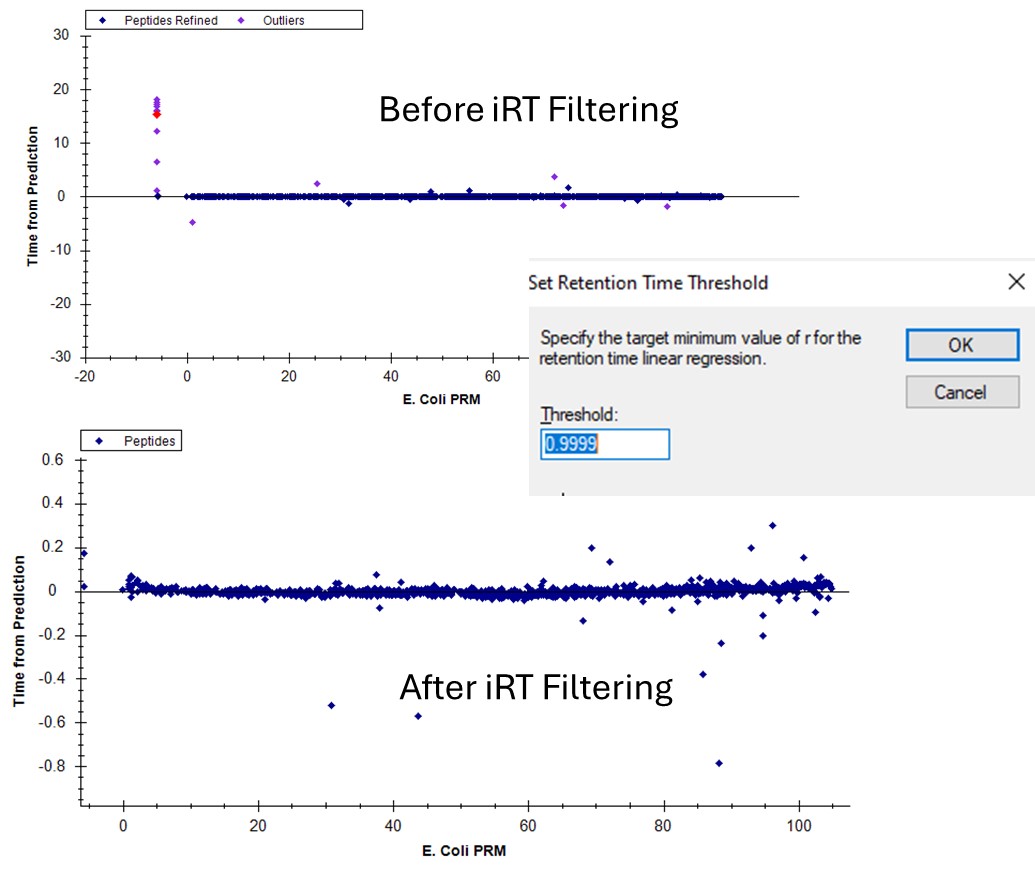
If we go back to the Run-to-Run regression, there are still a few outliers. Apparently we can't yet filter based on the experimental Run-to-Run deviations, but maybe in the future. This iRT filtering maybe wasn't as powerful in this example as just using the CV and PRM Conductor filtering, but it's another tool in our belt.
You've reached the end of this tutorial. Hopefully have a good idea of how to create an assay based on Stellar MS discovery results.
| Attached Files | ||
step3_1making_blib.jpg step3_2skyline_doc.jpg step3_3prmc_settings.jpg step3_4runtorun.jpg step3_5irt_calculator.jpg step3_6irtbackground.jpg step3_7irt_filtering.jpg