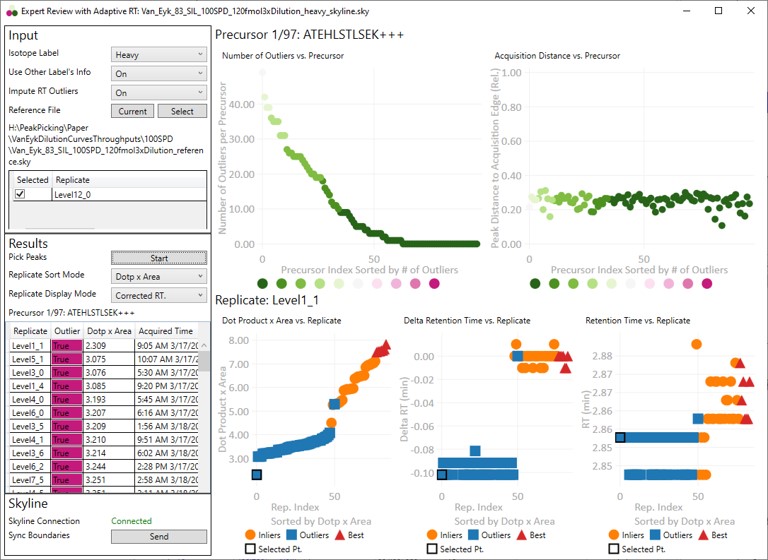
Expert Review Quick Reference
Expert Review is an application that helps achieve consistent peak integration boundaries, through the use of replicate-level and experiment level correlations to reference data of various types.
These parameters change how the calculations will be performed. They take affect once the Results:Start button is pushed.
- Isotope Label
Determines whether a specific isotopically-labeled version of the precursor is used for setting the boundaries. Skyline's Isotope Label Type report column is used as input data.
- Not Specified
- The isotope label type is not considered. Use this mode for label-free experiments. If this mode is used for data with light and heavy labels, the boundaries that are actually used could come from either molecule (not recommended).
- Heavy
- The integration boundaries from the heavy labeled precursors will be sent to Skyline.
- Light
- The integration boundaries from the endogenous, or light, precursors will be sent to Skyline.
- Use Other Label's Info
- This parameter is only visible if the Isotope Label parameter is set to Light or Heavy.
- On
- Experiment-level replicate analysis will use information from the other label when attempting to place consistent integration boundaries. Ex. information from the light precursor is used to help determine the heavy precursor boundaries.
- We recommend to use "On", but include this option in case the light data are not consistent between replicates and are hampering the boundary location accuracy.
- Off
- Experiment-level replicate analysis will not use information from the other labeled precursor.
- Impute RT Outliers
- On
- Uses a local regression analysis of retention time and raw file acquisition time to attempt to identify and correct retention time outliers.
- This algorithm is applied after the cross-corrleation based experiment-level replicate analysis.
- This algorithm uses information from the retention times and acquisition times "best" replicates. If these best replicates are all acquired at the start of an experiment, and there is later significant RT drift, the algorithm is not very accurate.
- This algorithm can be useful if there are retention time drifts that vary smoothly with acquisition time. Only use this mode if there are no abrupt shifts in retention time between replicates. Such shifts will cause this algorithm issues.
- Off
- No local regression analysis of retention time and raw file acquisition time is used. The cross correlation-based experiment-level analysis is still used, however.
- Reference File
Expert Review relies on information from a reference replicate or replicates to perform integration boundary determination. The reference can be currently be selected in two ways.
- Current
- Select this button to update the Replicates grid with information from the current Skyline file.
- Select
- This button will open a file chooser, whereupon the user can choose another Skyline file to use as a reference. This can allow for faster processing, since the reference data can be smaller and load faster. The only gotcha is that if your reference file transitions for some reason don't overlap with the experiment transitions, or there were precursors in the experiment file that aren't in the reference file, there would be an error.
- Reference File Text Box
- The current reference Skyline file is displayed here. Note that for convenience, Expert Review remembers your last choice of reference Skyline file. This can get you into trouble when you use Expert Review for a new experiment, and you have the old reference specified.
- Reference File Replicate Grid
- The replicates for the reference Skyline file are displayed. For files with multiple replicates, you can select which one or more replicates to use as reference.
- Multiple replicates might make sense in a multi-injection replicate scenario, where all the precursors are spread amonst replicates.
- If you selected multiple replicates, and the same precursor is in both replicates, the replicate information that is actually used is not well defined.
Results
These parameters are for starting the processing, or perusing the results.
-
Pick Peaks
- Press this button once the Input parameters have been set. The processing will start, which could take some time, depending on the size of the Skyline file. For many experiments, it takes less than a minute. The largest Skyline file we tried ha 1000 replicates for 83 precursors. It took 40 minutes for Skyline to export the report, and 5 minutes to determine the integration boundaries.
- After the processing finishes, the selected precursor in Skyline becomes the one with the most outliers that were corrected with Experiment-level scoring. If this gets annoying for users, we can remove this feature.
-
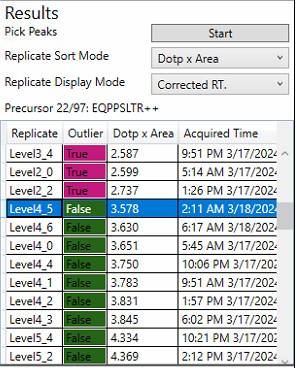
Replicate Sort Mode
- Dotp x Area
- The replicates in the grid and the lower plots are sorted from lowest-to-highest dot product times peak area. This can be useful because this is what Expert Review does when categorizing the replicates.
- Acquire Time
- The replicates in the grid and the lower plots are sorted from lowest-to-highest .raw file acquisition time.
-
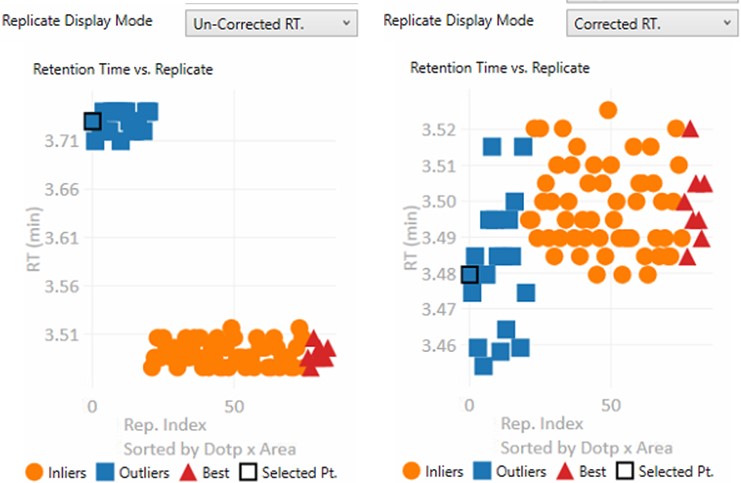
Replicate Display Mode
- Un-corrected RT.
- The retention time graph presents the retention times as they were after the Replicate-Level scoring. These retention times are never sent to Skyline
- Corrected RT.
- These are the retention times after both Replicate-Level and Experiment-Level scoring. These retention times are sent to Skyline when the Send button is pressed.
-
Replicate Grid
- The currently selected precursor name, and outlier order number is displayed at the top of the grid. The outlier order number is the rank order of this precursor, where #1 has the most outliers that were corrected with Experiment-level scoring, and the last (97 for this assay) has the fewest outliers.
- Clicking any row will sync this precursor and replicate to Skyline, so you can see what the chromatogram looks like. The graphs on the right will be updated to display a black outline around the currently selected replicate.
- If the grid is selected, you can press the Up and Down key to advance the rows.
Skyline
This section is used to send the Expert Review integration boundaries to Skyline.
- Skyline Connection
- This field reports whether the associated Skyline file is open or not. If the Skyline file is closed, then the integration boundaries can no longer be sent to that file
- Send
- Pressing this button causes the calculated integration boundaries from Expert Review to be imported to the associated Skyline document.
Graphs
Clicking on any point is synchronized with Skyline, such that the chromatogram for that precursor is displayed. Clicking on a point will update the lower graphs with the replicate information for that precursor. Pressing the Left or Right key will advance the precursor in that direction.
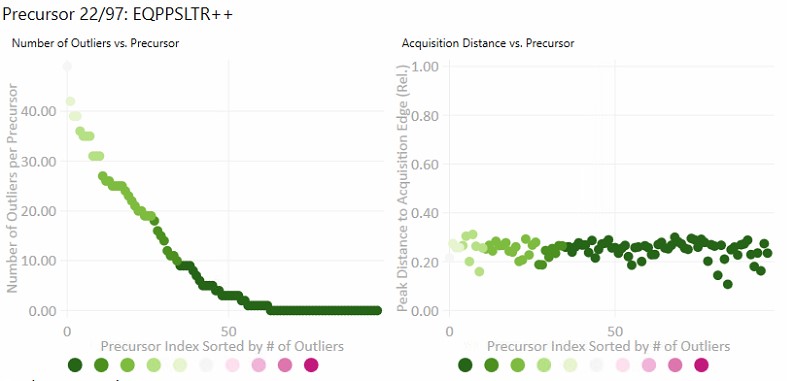
- Precursor-level graphs
- Number of Outliers
- The left plot displays the sorted number of outliers that were corrected by the Experiment-level scoring for each precursor. The fact that a precursor has many corrected outliers does not necessarily mean that there will be any integration boundary errors in the final output. It does mean that there is some ambiguity though in the data, and it is probably worth investigating the precursors with the most errors.
- Acquisition Distance
- This plot depicts the average relative distance of the peak apex to an edge of an acquisition. For example, if the peak is at 10.4 minutes, and the acquired spectra spanned the range from 10.0 to 12 minutes, then the relative distance would be 0.4 / 2.0.
- It may be worth investigating precursors that have very small acquisition distances to see if there is any truncation of the peaks.
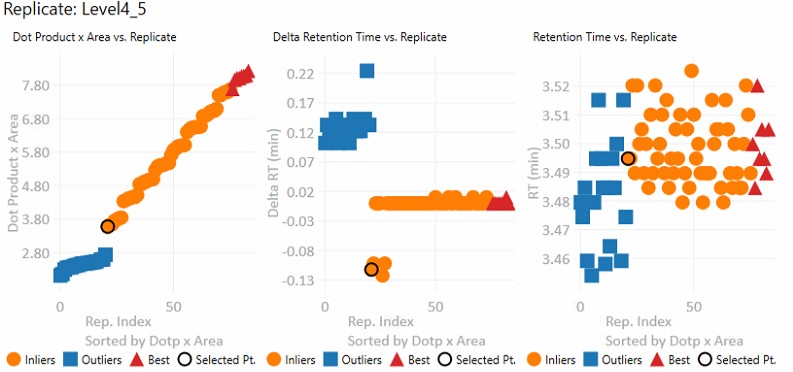
- Replicate-level graphs
These graphs show information for all the replicates for the currently selected precursor.
- Dot product x Area
- The dot product is relative to the reference data set. This metric is a way to rank the quality of a replicate.
- The "best" group, in red triangles is determined by this metric.
- Inliers are replicates that aren't in the best group, but did not have their RT updated by Experiment-level scoring.
- Delta Retention Time
- This is the difference between the peak RT. and its average neighbor's peaks RT. This value is likely to be conserved even when there is an absolute RT shift across replicates, and we have investigated using this value for outlier identification and correction.
- Retention Time
- These are the apex retention times of the picked peaks. They can be displayed with the Experiment-level outliers corrected, or uncorrected, depending on the value of Results:Replicate Display Mode.