Absolute Quantitation - PQ500
For this walkthrough, we will use data from our paper on Stellar MS with Adaptive RT and PRM Conductor. This section uses a dilution of the Biognosys PQ500 sample in plasma.
- Obtain the Skyline data files in this Panorama repo, in the Raw Data \ Expert Review folder. Open the Skyline file Absolute Quantitation \ 60spd_dilution_lightheavy_skyline.sky.
For me, the document opened with the NLVVIPK peptide selected, illustrating one of the great challenges of performing dilution curves with samples like the PQ500. You can use Ctrl+F and search for this peptide sequence, or peruse the document ande find many other such examples. Many of the targets, like this one, don't have appreciable endogenous signal, therefore peptides like this one will be problematic to analyze if the Skyline document is set to Settings / Peptide Settings / Modification Settings / Internal Standard Type / Light. Of course there are some peptides. like LVTDLTK from Albumen, that have enormous endogenous signal, and for which there is no issue using the Light Internal Standard Type for a dilution curve. If the Internal Standard Type is set to Heavy, there traditionally were problems when the dilutions are low enough that there is little to no Heavy standard signal, and the boundaries would get set more or less randomly. Expert Review aims to fix this problem.
Expert Review - Light Boundary Mode
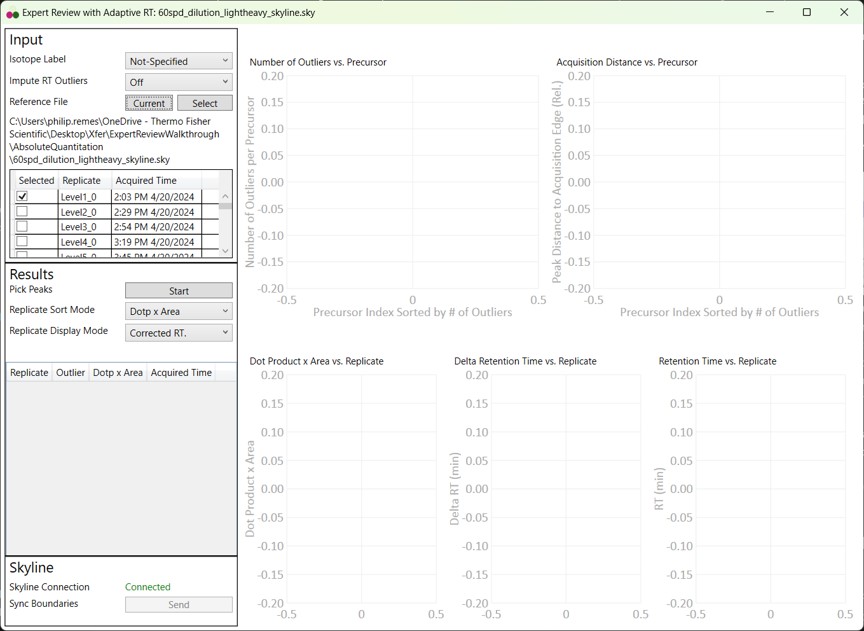
First we will look at the Expert Review results with the light Isotope boundary type, to illustrate the potential pitfalls of this mode for large assays that don't have much endogenous signal for many targets. Launch Expert Review after having installed or upgraded your PRM Conductor instance, by running Tools / Thermo / Expert Review. You will see the green progress bar move as Skyline exports the data set, and finally Expert Review will open. If this is the first time that you've run Expert Review, the Reference Grid will look like below, where the replicates for this experiment are listed. The replicates are listed from first-acquired to last-acquired, and the first replicate has a checkbox next to it.
- If you select the checkbox, the grid will be highlighted in red, and you can't press the Results:Start button. We always need to have at least one reference replicate selected.
- If you are using a replicate from the same Skyline file you are using for analysis, and it isn't the first-acquired replicate, you'll have deselect the first replicate, find the replicate you want, and select it.
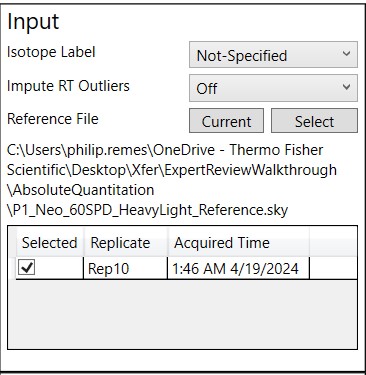
- I like to save the reference replicate in another separate Skyline file and press Select to open a file-chooser, and select that file.
- Expert Review remembers the last reference file that you used, which is someties convenient, but sometimes annoying when you switch experiments and forget to change the reference, and then there will be errors when your reference precursors don't include your experiment precursors.
- Press the Select button, and choose the other Skyline file in the Absolute Quantitation folder, P1_Neo_60SPD_HeavyLight_Reference.sky. This file has the last replicate from a test of the measurement precision of the assay.
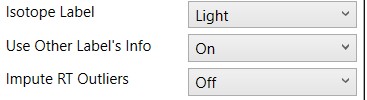
- For the first test, select Isotope Label Light. When Isotope Label is set to Light or Heavy, a new option appears, Use Other Label's Info. This allows to use the data from the other isotope label, in this case the heavy data, to ensure a more consistent integration boundary position. Usually this is a good idea. There could be some case where the other isotope label data are not very constant, which is why there is an option to turn this off, but it defaults to On.
- I usually set Impute RT Outliers to On, if there is a smoothly varying trend of RT with acquisition time, or no RT drift, as this option could help the peak picking accuracy, by on the order of tenths of a percent. However there have been cases where experiments have some sharp change in retention time between replicates, where this option doesn't work as well as you might want it to.
- Press the Start button and the processing starts. On my laptop, it takes 1 minute to process the data for these 804 light/heavy precursors and 55 replicates.
- Note that we have not pressed the Send button yet, so Skyline still has its original integration boundaries.
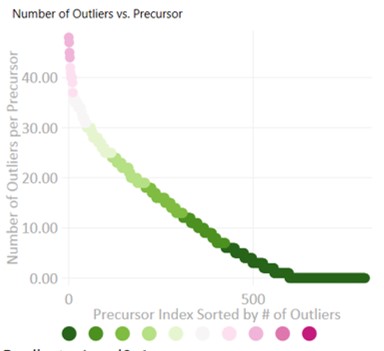
- When the processing finishes, Expert Review ranks the peptides according to how many adjustments were made on the Experiment-level. This is a general measure of how big of a challenge the data posed. Right now, the first, or worst quality precursor is selected when the processing is finished.
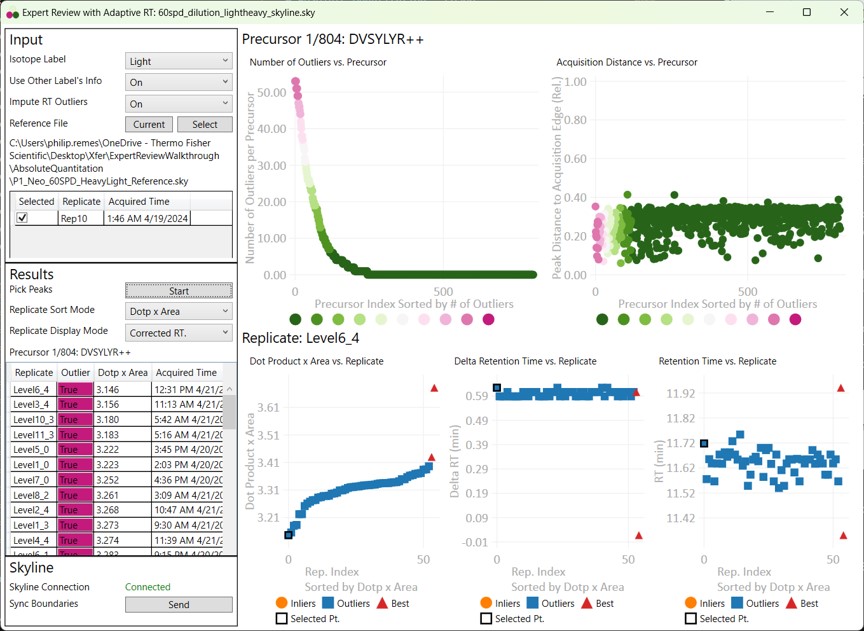
- Skyline is synced to Expert Review in a one-way mode, such that the active precursor in Expert Review is made active in Skyline, but not vice-versa.
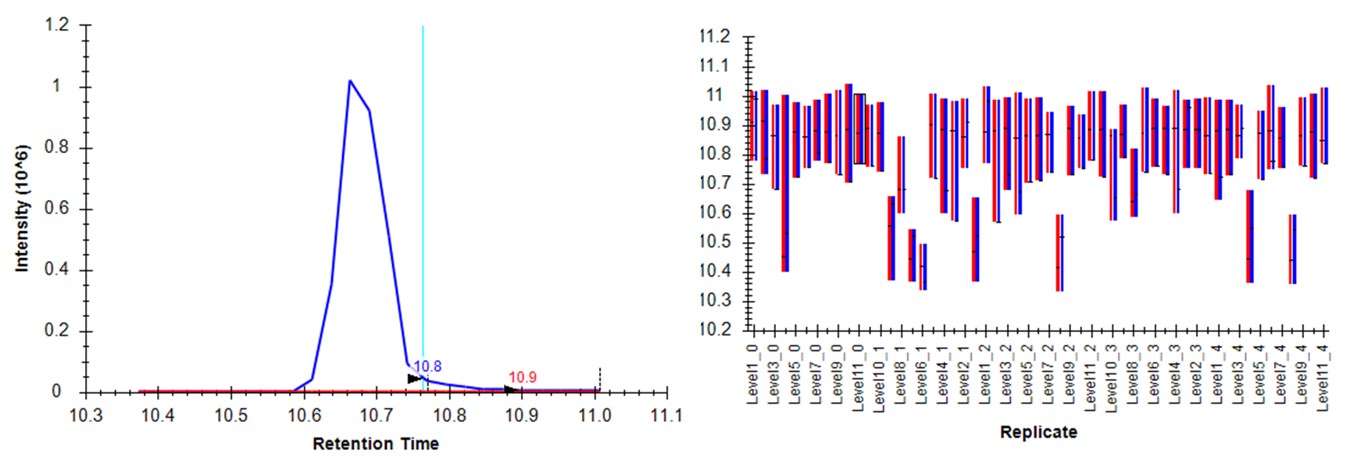
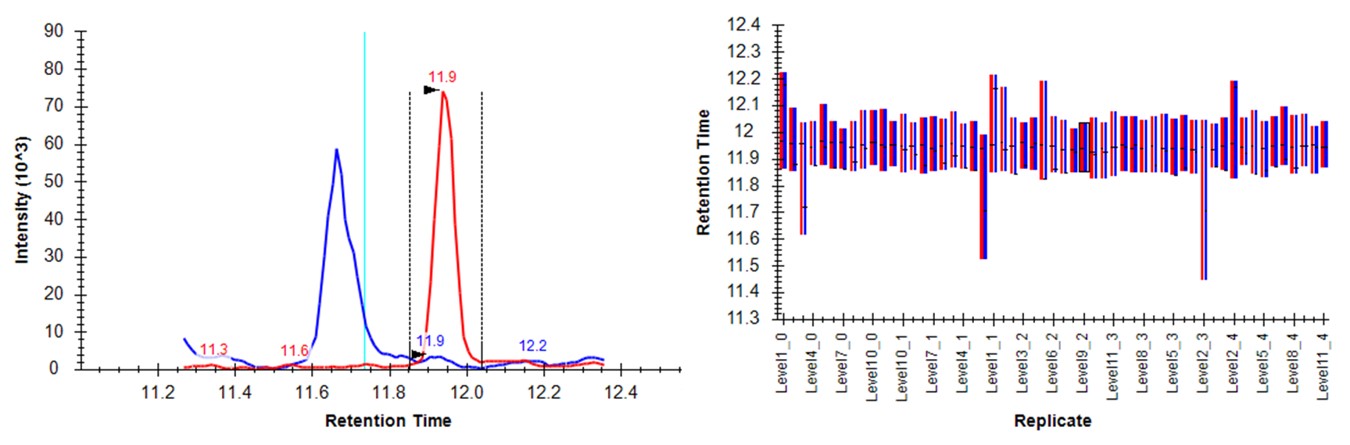
- Switch to the Skyline document to see the chromatograms for DVSYLYR, the one that has the most outliers. This is a challenging one for the light mode, because there is a huge endogenous peak at a retention time that is nearby to the heavy standard.
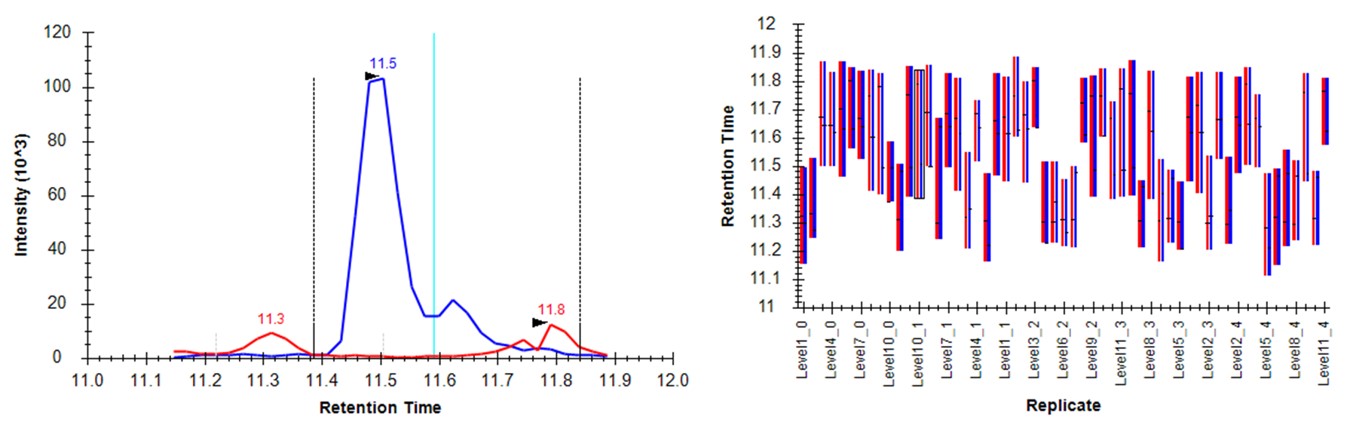
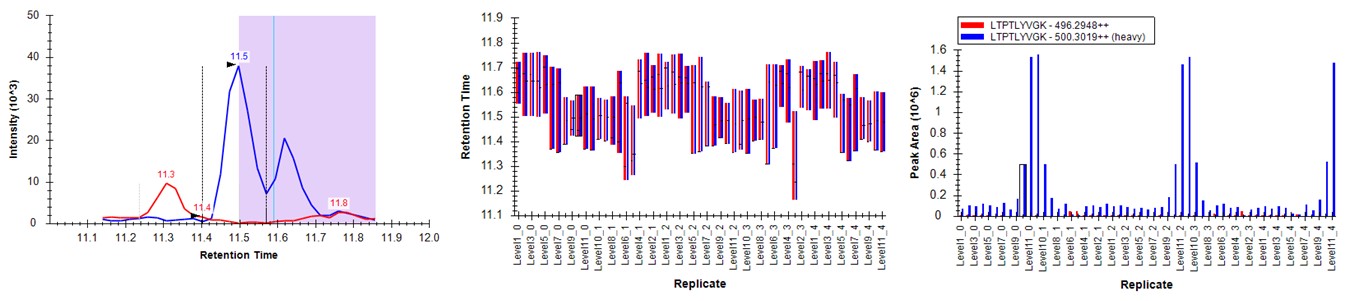
- Either press the Right key 3 times, or try to click the mouse on the 4th dot on the Number of Outliers vs Precursor graph. You can also zoom in on the plot with the mouse wheel, and double click to unzoom. You'll have highlighted the LTPTLYVGK precursor. This one has an endogenous time profile that is variable and does not present a clear pattern. It's no wonder that Skyline had a hard time here, using light boundaries.
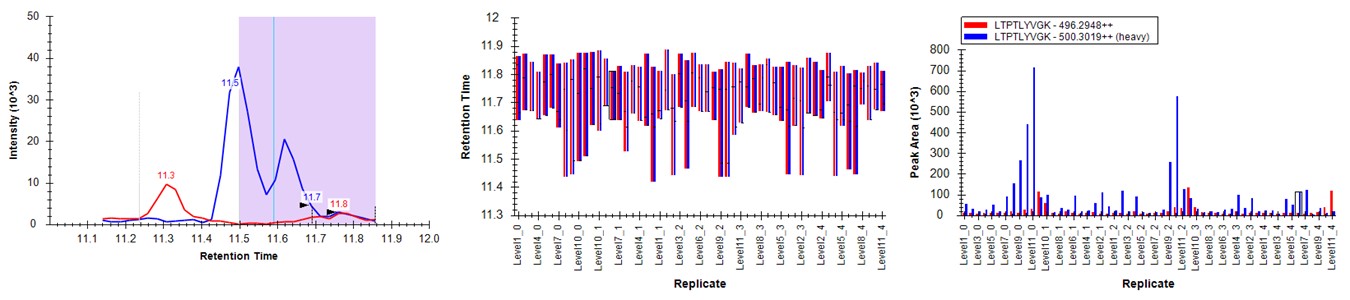
- Press the Send button. Skyline will take a few moments to import the Expert Review boundaries, and will stay on the LTPTLYVGK peptide. Now the boundaries are certainly more consistent, but they are in the wrong place, because the light data don't have a very good peak in the neighborhood of the actual heavy standard peak. The areas of the heavy peptides don't match with the expected dilution trend. This example shows again the perils of using light boundaries when there is no good light reference peak. If you go back to the DVSYLYR peptide, you'll see that here the results are not so satifactory either. In any event, Expert Review let us know which precursors were the most problematic. If you peruse the precursors that had fewer outliers corrected, the results are excellent. Let's see how things improve when we use the heavy peak boundaries.
Expert Review - Heavy Boundary Mode
- Select Isotope Label Heavy, and Press the Start button. When the processing finishes, press the Send button. Notice that now the outliers plot shows that most precursors have many more replicates that needed Experiment-level correction. This makes sense, because every precursor is getting diluted below its limit of detection, eventually, and its replicate data no longer matches the reference.
- Peruse the data a little bit, pressing the Right key on Expert review to look at the most challenging cases. They look good! In some cases, there are early eluting peaks with variable peaks that give poor results, or very nearby interferences that affect the absolute peak areas. There could be some improvements to be made in terms of making the integration boundary widths more consistent.
- If we look at the LTPTLYVGK example from before, the low level interference does move the boundary a little bit, but the areas of the peaks are much more in line with the dilution curve.
Conclusion
When performing dilutions of heavy standards in an endogenous background, use the heavy boundary mode, unless you are sure that all or most of the peptides have appreciable endogenous signal to use as references.