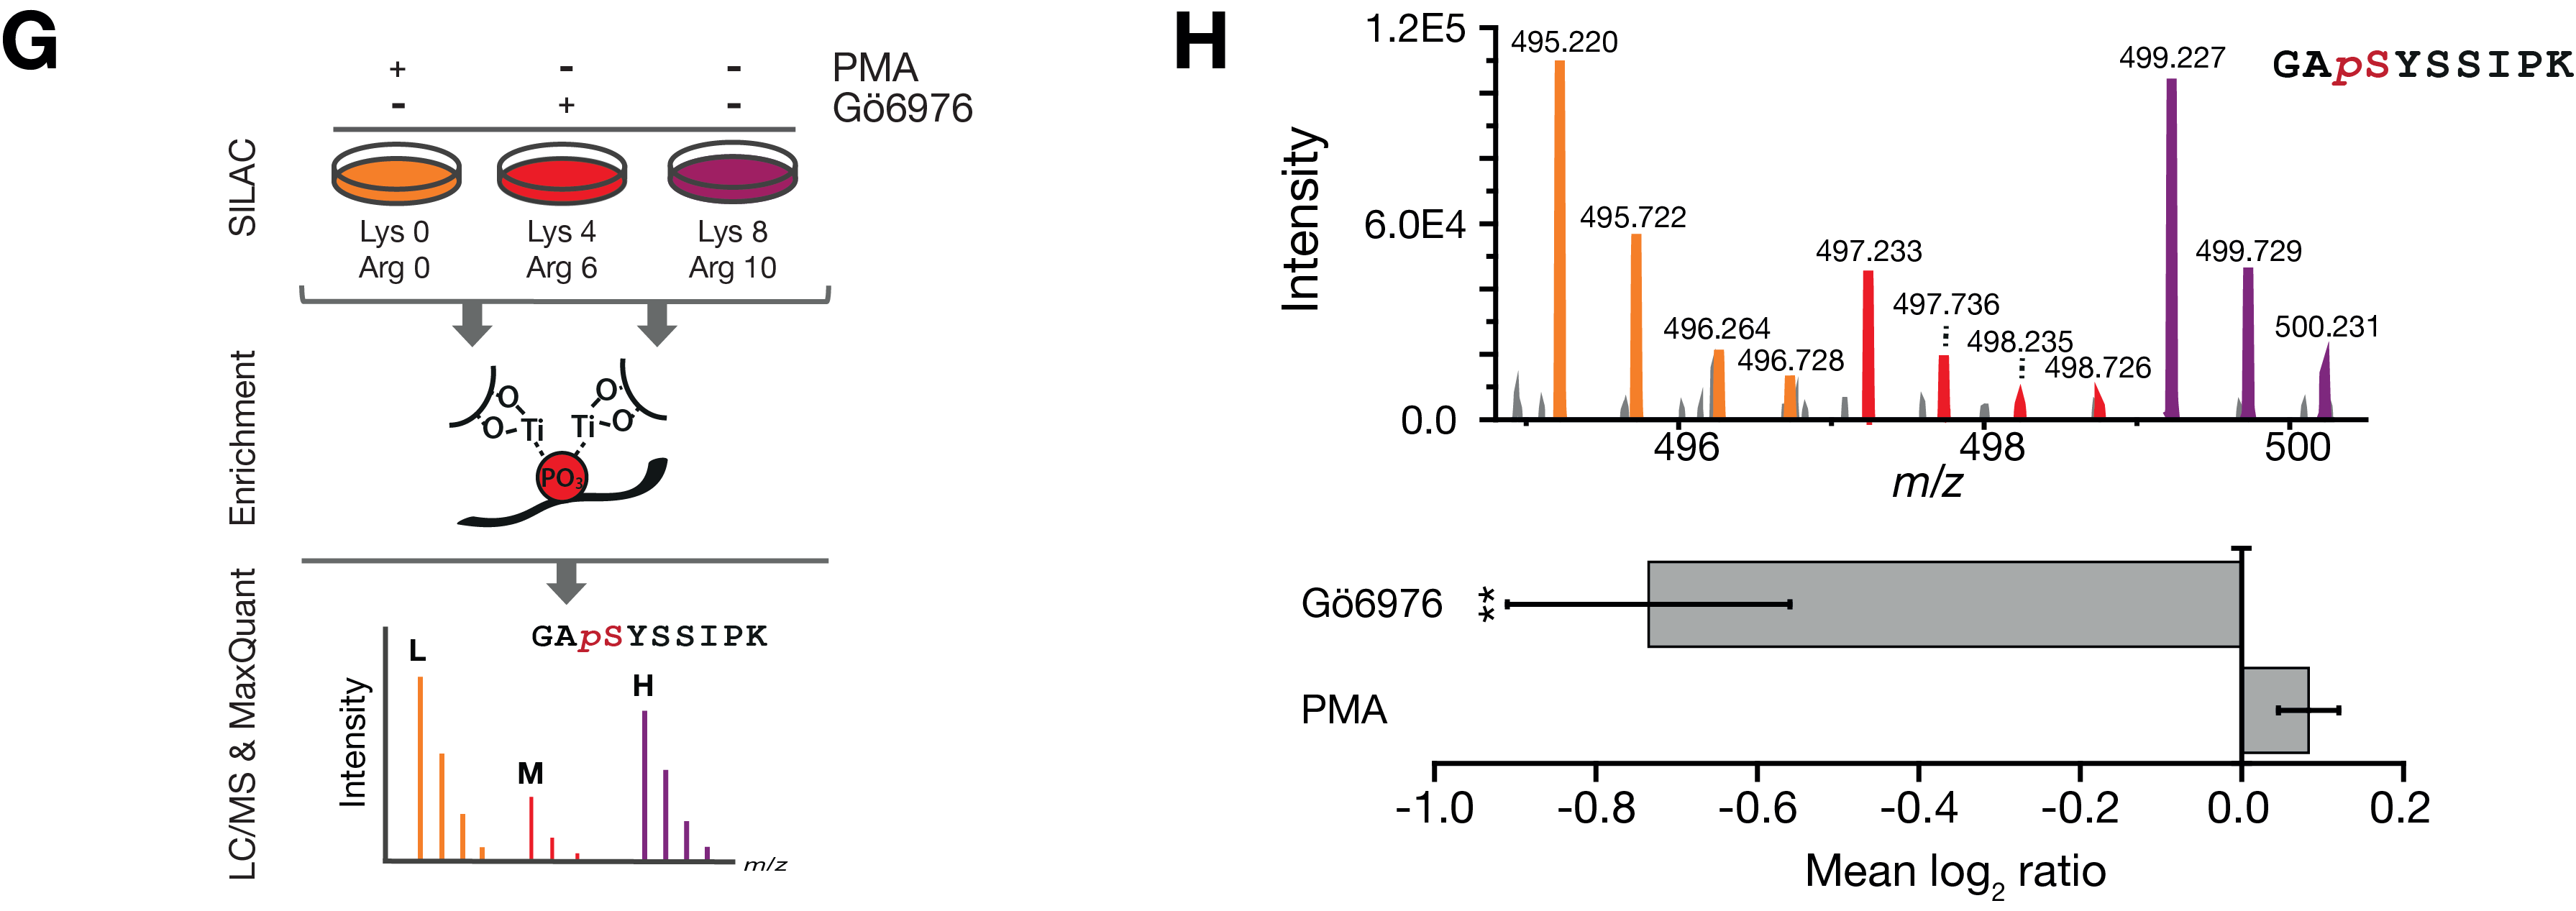
Figure 4 G-H, Experimental approach of quantitative in vivo kinase assay in contracting myotubes (G) and results for the regulated
peptide, phosphorylated at S2625 (H). Quantification of data shown was performed with skyline for n=3 independent experiments.
Shown is the mean log2 ratio of the area under the curve ± SEM. **p ≤0.006.

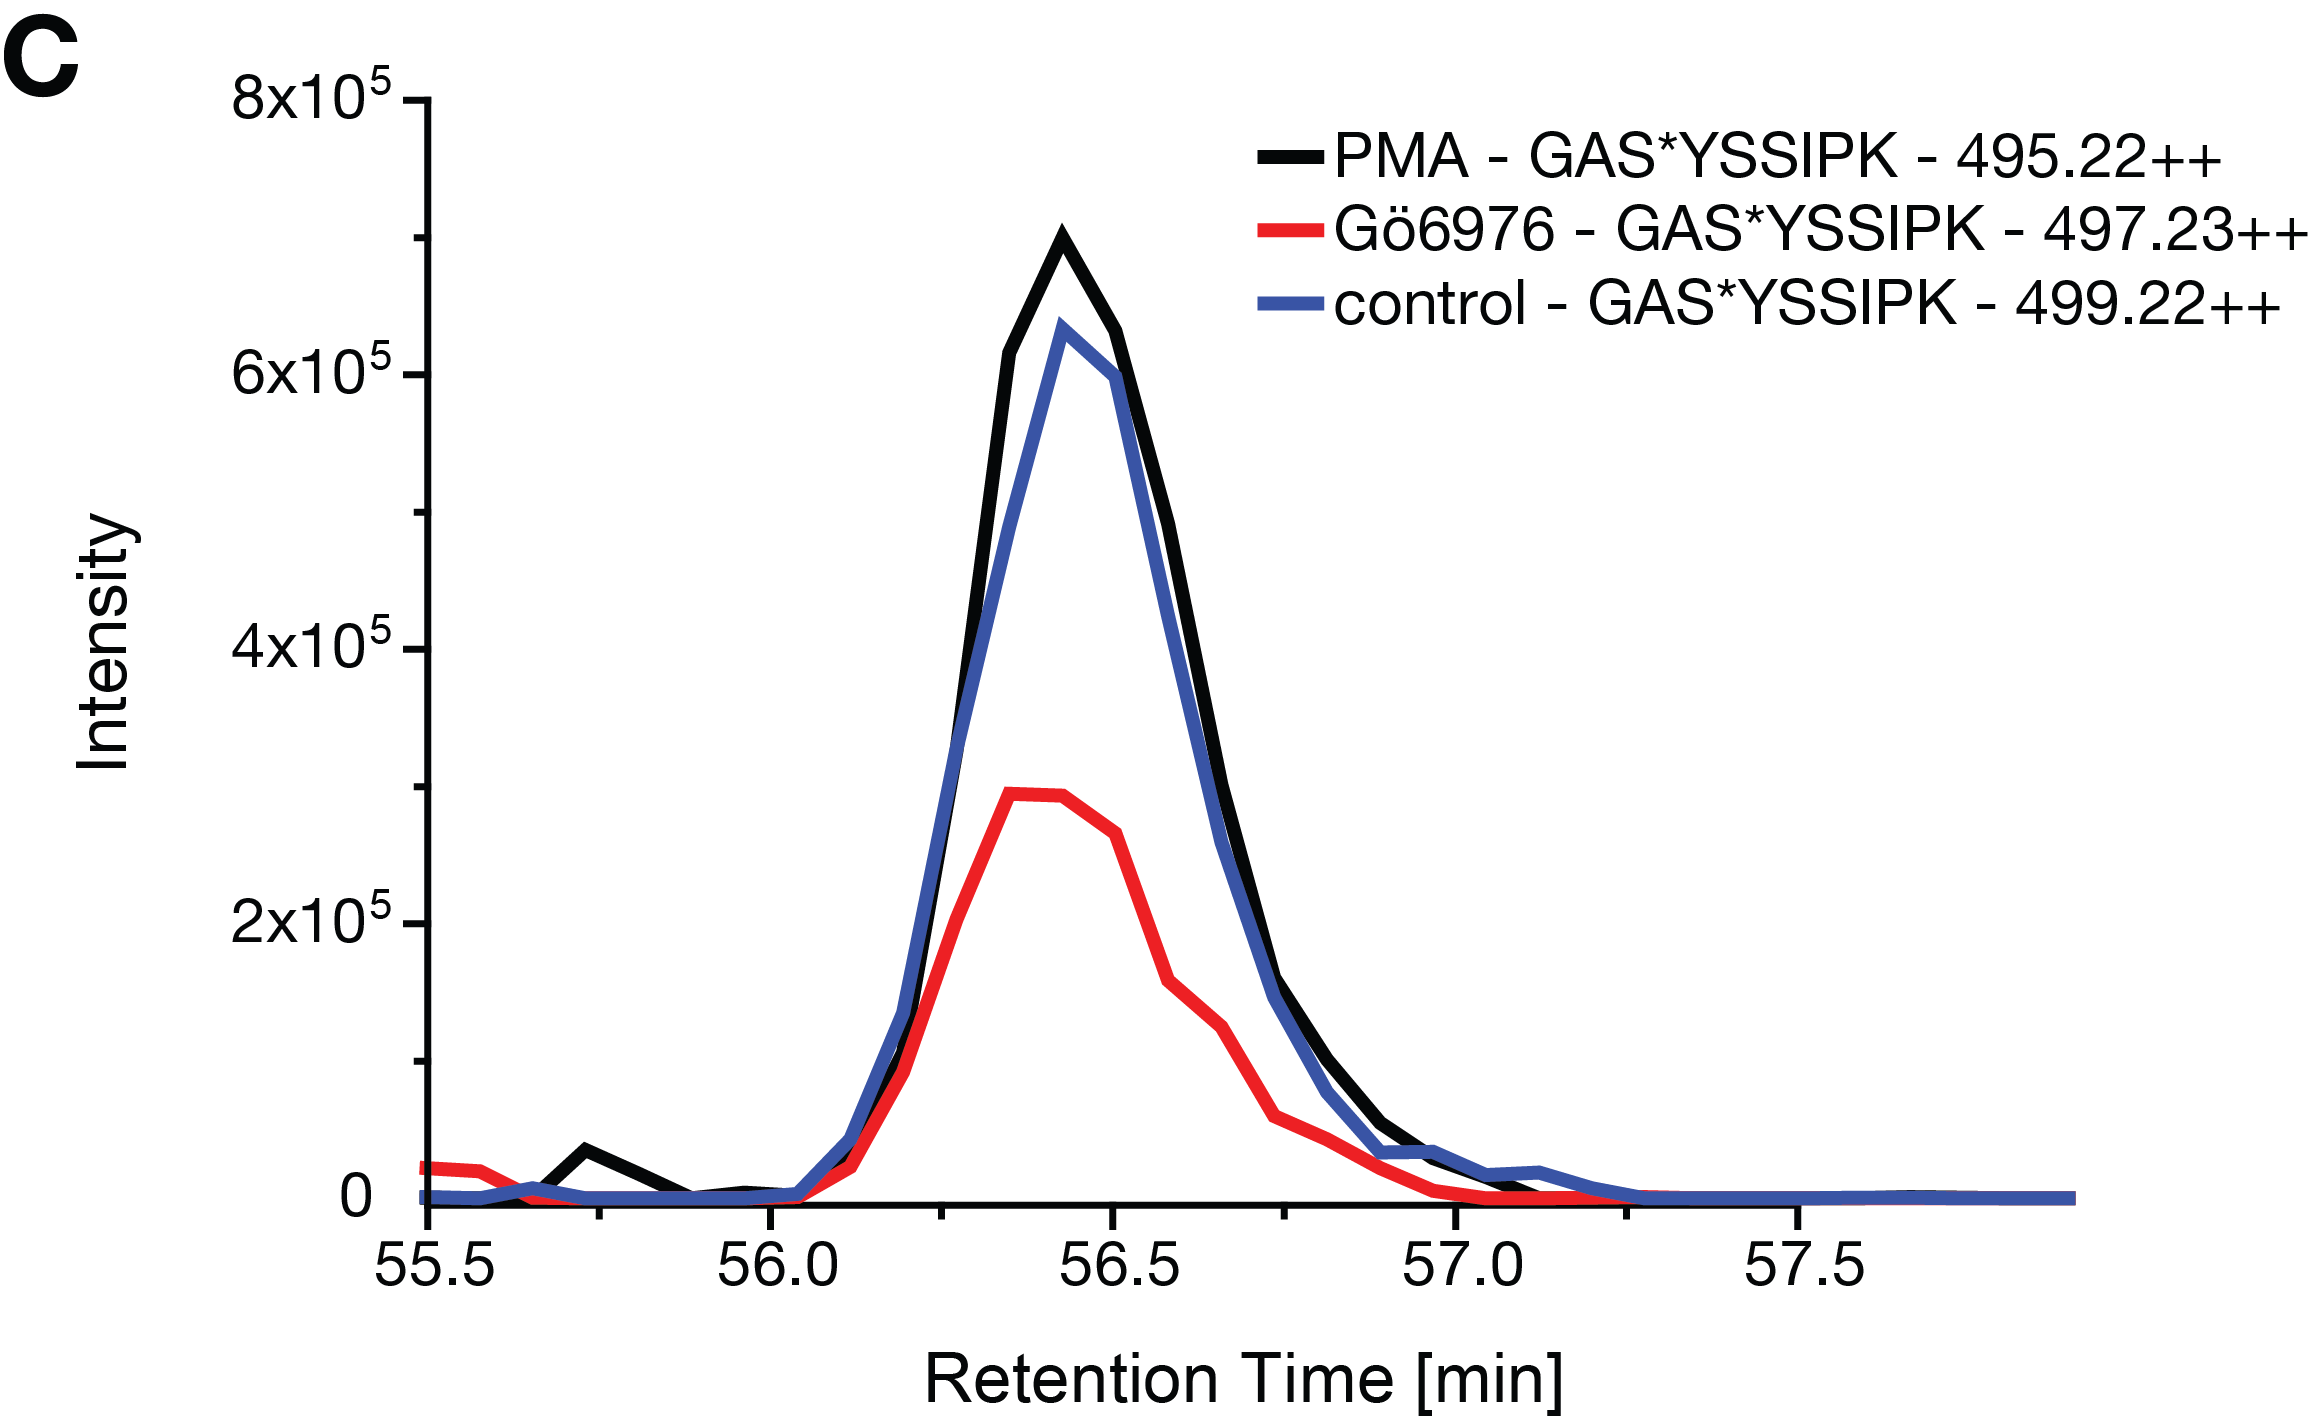
Figure S3C, Extracted ion chromatogram of the phosphopeptide GApSYSSIPK within
fraction 1 in the biological replicate 3 of the in vivo kinase assay.