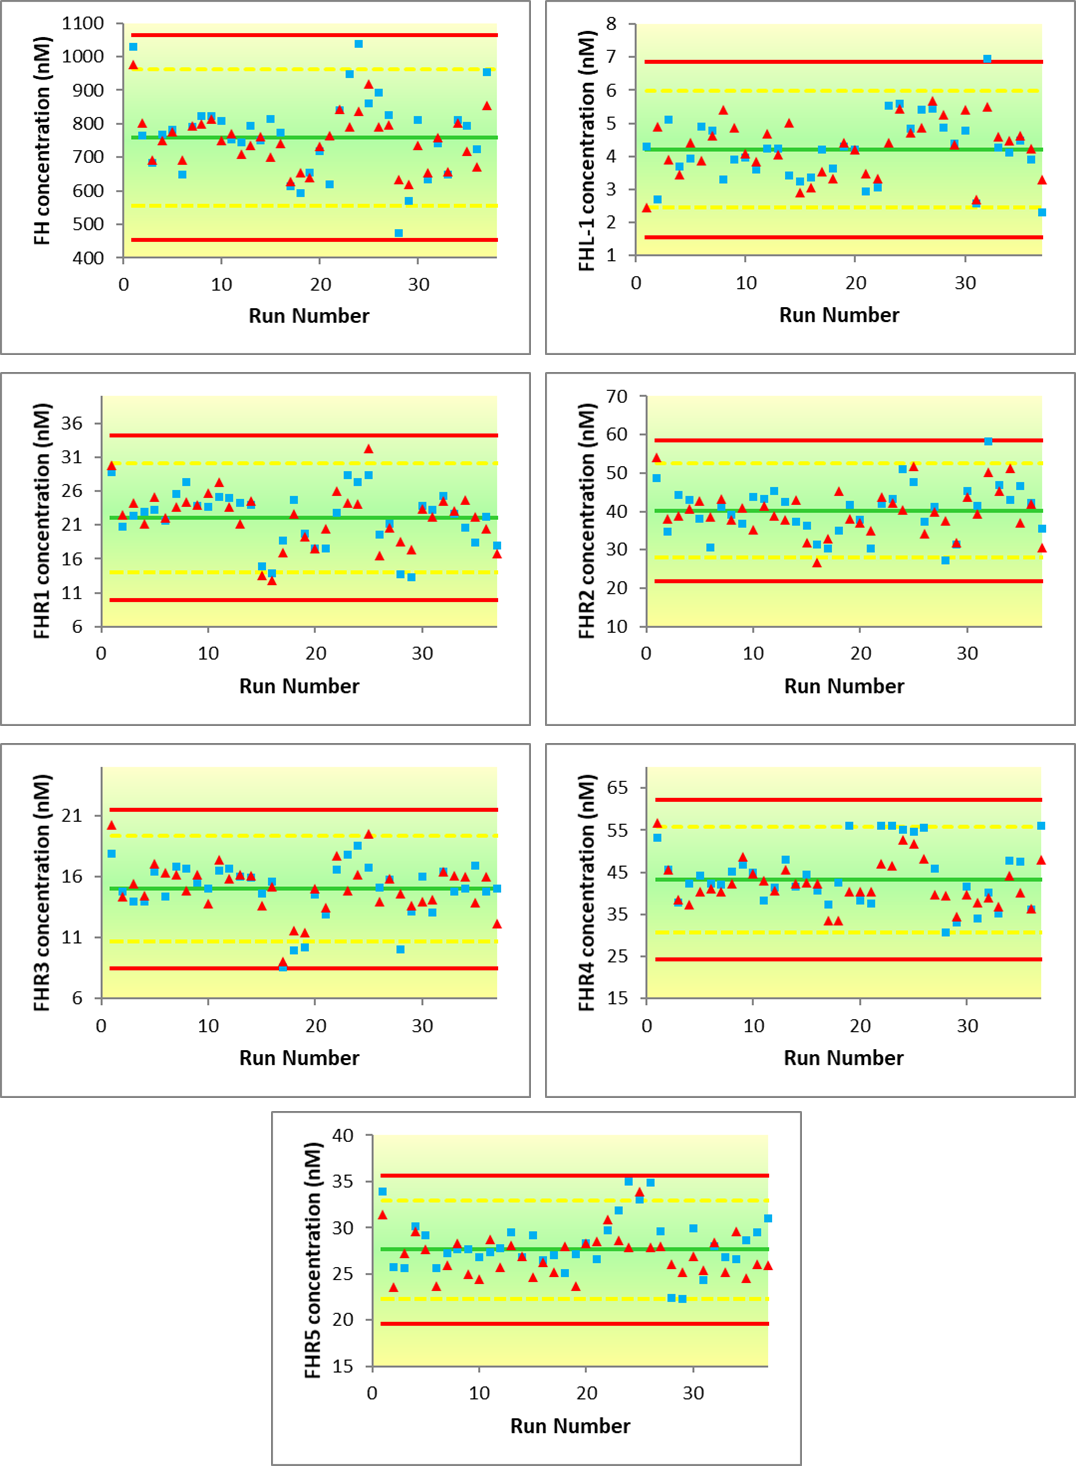
Supplementary Figure 4
Levy-Jennings graphs to monitor between-batch stability of the whole process across the course of the study.
Measured concentrations for each protein in two replicate analyses of the same sample included in each batch were monitored. Green line = mean concentration, Yellow line = +/- 2x s.d., Red line = +/-3x s.d.