Characterization of a human pluripotent stem cell-derived model of neuronal development using multiplexed targeted proteomics
Tom Dunkley1,*Veronica Costa2, Arno Friedlein1, Sebastian Lugert2, Stefan Aigner3, Martin Ebeling1,Meghan T. Miller2, Christoph Patsch4, Paolo Piraino5, Paul Cutler1 and Ravi Jagasia2,†
PROTEOMICS – Clinical Applications (2015)
http://dx.doi.org/10.1002/prca.201400150
: Human pluripotent stem cell (hPSC)-derived cellular models have great potential to enable drug discovery and improve translation of preclinical insights to the clinic. We have developed a hPSC-derived neural precursor cell model for studying early events in human brain development. We present protein-level characterization of this model, using a multiplexed SRM approach, to establish reproducibility and physiological relevance; essential prerequisites for utilization of the neuronal development model in phenotypic screening-based drug discovery.
: Profiles of 246 proteins across three key stages of in vitro neuron differentiation were analyzed by SRM. Three independently hPSC-derived isogenic neural stem cell (NSC) lines were analyzed across five to nine independent neuronal differentiations.
: 175 proteins were reliably quantified revealing a time-dependent pattern of protein regulation that reflected protein dynamics during in vivo brain development and which was conserved across replicate differentiations and multiple cell lines.
: SRM-based protein profiling enabled establishment of the reproducibility and physiological relevance of the hPSC-derived neuronal model. Combined with the successful quantification of proteins relevant to neurodevelopmental diseases, this validates the platform for use as a model to enable neuroscience drug discovery.
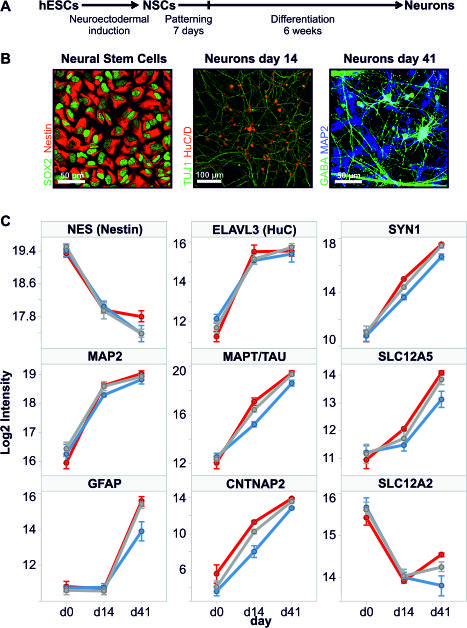
Figure 4. In vitro hPSC-derived neuronal model recapitulates aspects of in vivo neurodevelopment based on profiles of key marker proteins. A, Schematic drawing of neuronal differentiation protocol. (hESC: human embryonic stem cells, NSCs: neural stem cells). B, Confocal images of human cells at indicated stages of differentiation immunostained with the indicated antibodies. C, Protein profiles of key marker proteins of neuronal maturation. Log2 intensity values were calculated from SRM transition data using the ‘quantification’ function in SRM stats. Cell line is indicated by colour: red, SA001; blue, SA001 GE1; gray, SA001 GE2. Error bars represent SEM (n=5-9).
