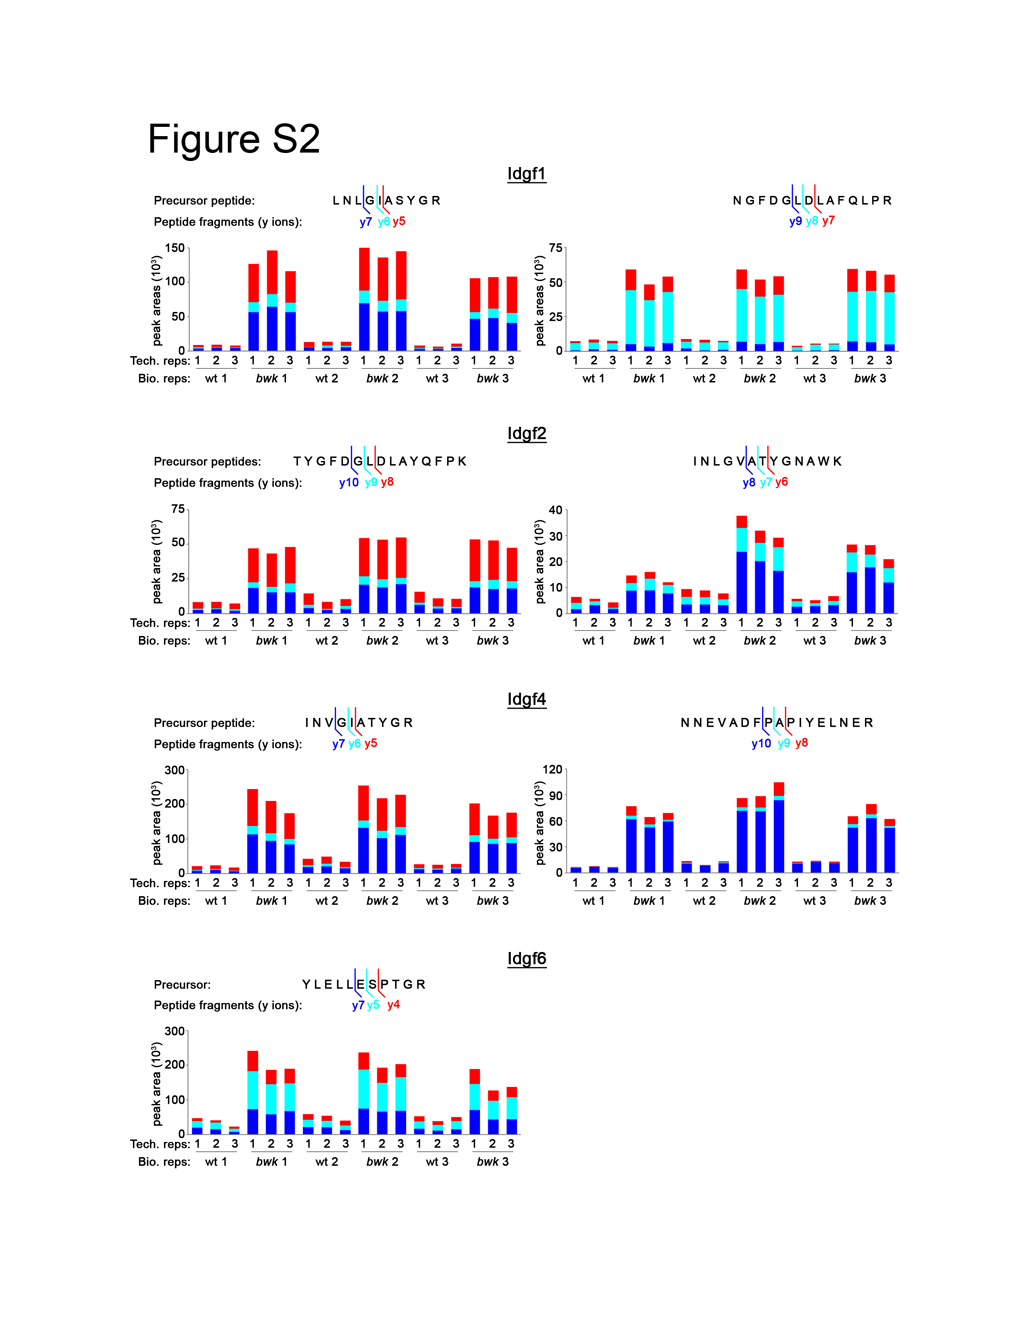
Figure S2. Targeted mass spectrometry reveals elevated levels of Idgf proteins.
Using selected reaction monitoring (SRM) mass spectrometry, we observed a robust increase in abundance of Idgf1, Idgf2, Idgf4, and Idgf6 in stretch cells from bwk mutant egg chambers relative to wild-type. The stacked bar-graphs compare relative abundance of each of the identified Idgf peptides in wild-type vs. bwk mutants. For each tryptic precursor peptide, the colors indicate proportions of the fragment peptides (y-type ions, y5 = 5-residue C-terminal fragment ion, y6 = 6-residue C-terminal fragment ion, etc.). Peak areas, which correlate to peptide abundance, were calculated by Skyline (Maclean et al. 2010) by integrating the area under the curves from chromatograms of y-ion intensities (see Figure 2). Three independent biological replicates were analyzed for each genotype, and three technical replicates were analyzed for each biological replicate.