Figure 4 |
2025-07-12 |
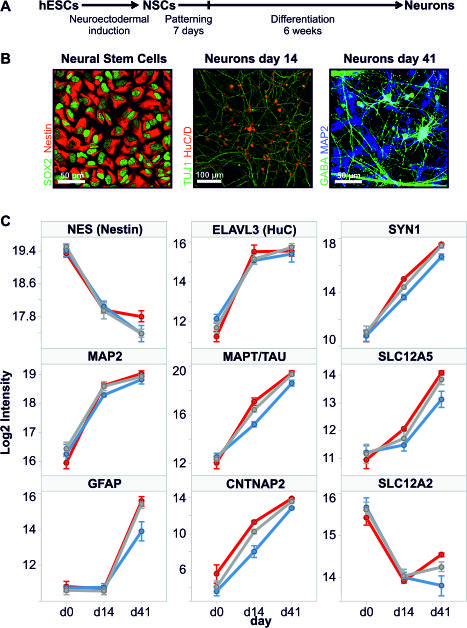
Figure 4. In vitro hPSC-derived neuronal model recapitulates aspects of in vivo neurodevelopment based on profiles of key marker proteins. A, Schematic drawing of neuronal differentiation protocol. (hESC: human embryonic stem cells, NSCs: neural stem cells). B, Confocal images of human cells at indicated stages of differentiation immunostained with the indicated antibodies. C, Protein profiles of key marker proteins of neuronal maturation. Log2 intensity values were calculated from SRM transition data using the ‘quantification’ function in SRM stats. Cell line is indicated by colour: red, SA001; blue, SA001 GE1; gray, SA001 GE2. Error bars represent SEM (n=5-9).