Table of Contents |
guest 2025-04-21 |
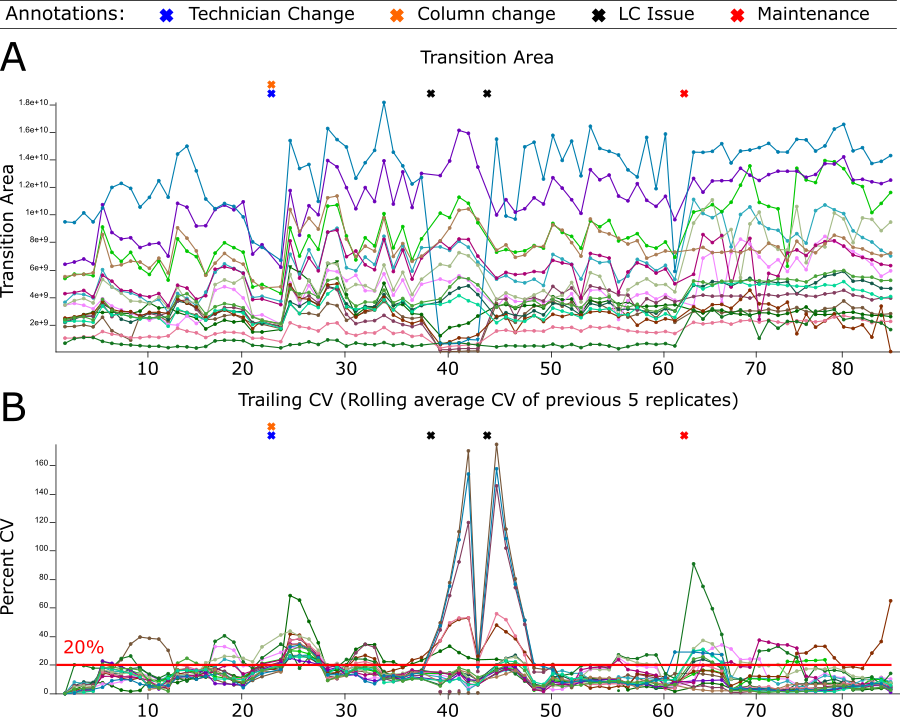
QC Figure 2
Figure 2 illustrates an example of how we track system suitability on one of our systems. In this case, we show PRTC and BSA peptides tracked with PRM in a standard sample run with different LC systems on a Thermo Orbitrap Eclipse Tribrid MS.