Table of Contents |
guest 2024-04-25 |
Additional Raw Data
Experimental design of in cellulo kinase assay
Immunoblot analysis of PKC alpha and Akt activities in C2 cells
Targeted MS data of hFLNc phosphopeptides comprising the phosphorylation sites pS2233, pS2233/pS2236 and pS2236.
MS2 spectra of hFLNc d18-21 S2233A and S2233D mutants
FLNc PRM analysis
Additional Raw Data
Raw data uploaded here is for the Skyline document PRMassay_FLNc+phosphostandard_pepmap.sky.zip. Additional raw data for this experiment is available in the ProteomeXchange dataset PXD009228.
Experimental design of in cellulo kinase assay
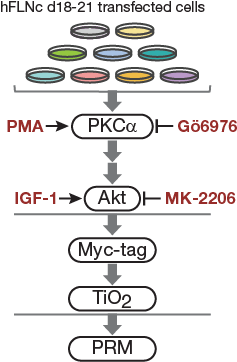
Fig4C.
Cell-based kinase assay. PKC activator PMA, PKCa inhibitor Gö6976 and Akt activator IGF-1 and inhibitor MK-2206 were used to activate or block signaling pathways in C2 cells. For targeted MS analysis, phosphopeptides were enriched by Myc-tag and TiO2-based enrichment.
Immunoblot analysis of PKC alpha and Akt activities in C2 cells

Figure 4D.
Immunoblot analysis of PKCα and Akt activities in C2 cells following pharmacologic interventions as indicated in 4C. Pan- and phospho-specific antibodies were used to detect total protein amounts and phosphoisoforms. GAPDH was used as loading control.
Targeted MS data of hFLNc phosphopeptides comprising the phosphorylation sites pS2233, pS2233/pS2236 and pS2236.
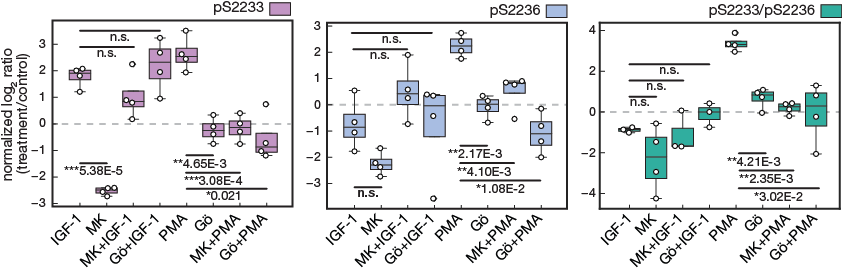
Figure 4e.
Targeted MS data of hFLNc phosphopeptides comprising the phosphorylation sites pS2233, pS2233/pS2236 and pS2236. MS data were quantified using Skyline and normalized to an internal phosphopeptide standard and the mock-treated control (DMSO). Intensities of phosphopeptides distinctive for a specific phosphorylation site in hFLNc d18-21 WT were added up per experiment and represented as normalized mean log2 ratio (treatment/control) ± SEM (n=4; *, p ≤ 0.05; **, p ≤ 0.01)
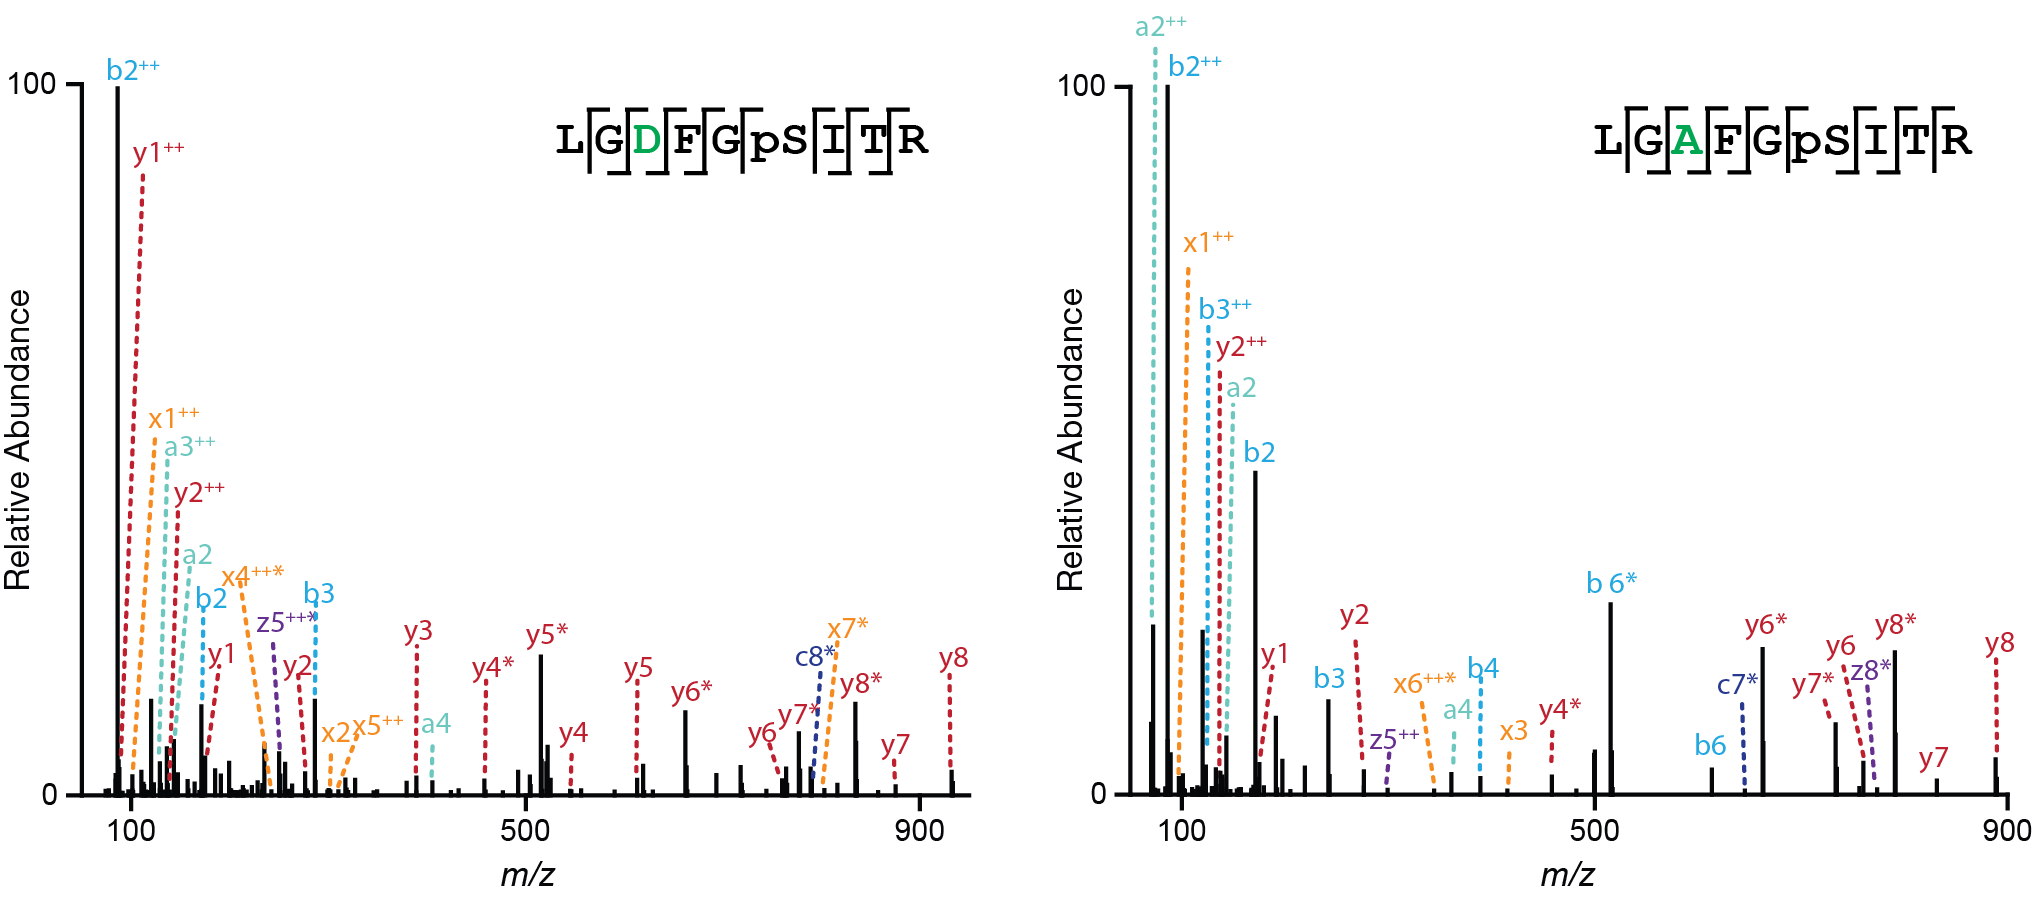
MS2 spectra of hFLNc d18-21 S2233A and S2233D mutants