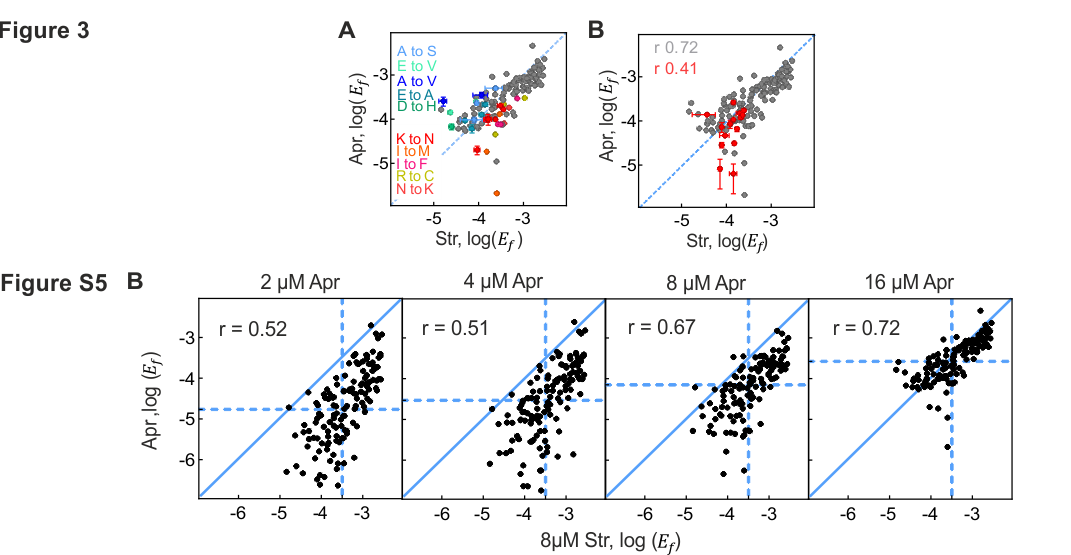
Figure 3 Apramycin induces proteotoxic misreading and inhibits translocation
(A) Single amino acid substitutions induced by Apr and Str. Errors induced preferentially by Apr (16 µM) are shown in cold colors; those induced by Str (8 µM) in warm colors. Error bars represent the standard deviation of three technical replicates.
(B) Error clusters in Apr-treated cells (red) compared to single amino acid substitutions (gray). Error bars represent the standard deviation of three technical replicates. The Pearson coefficients are 0.72 for single errors and 0.42 for error clusters.
Figure S5 Effect of Apr on misreading and translation. Related to Figure 3
(B) Comparative analysis of the error landscape of Str and Apr. Pearson coefficients are shown as insets.